What Google crawls on your site, when and with which bot, without having to ask for the server logs.
What it does
Every time a request that identifies itself as Googlebot reaches your site, the plugin records the time, IP, URL and user agent in a text file, one per day.
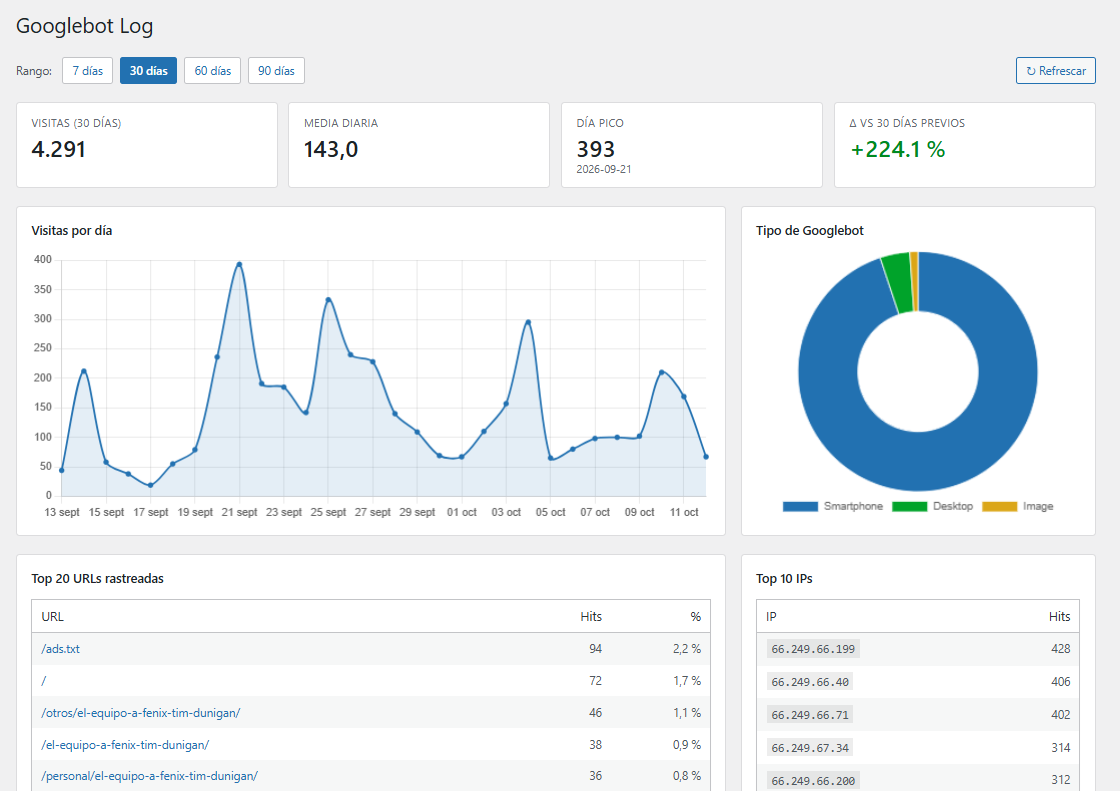
Under Tools it adds a dashboard that reads those files and shows total visits, the daily average, the peak day and the change against the previous period, a chart of visits per day, the split by bot type (smartphone, desktop, image, video, news) and the 20 URLs and 10 IPs with the most visits.
Why watch the crawl
Search Console summarises crawling, but it won't show you request by request which URLs Googlebot visits each day. With this log you can see whether the bot is spending its visits on URLs you don't care about (parameters, feeds, tag archives), whether it has stopped visiting a section, or whether a change to the site has sent crawling up or down. And to spot bots pretending to be Google, the dashboard reminds you which IPs genuine Googlebot comes from.
How it works
- Activate the plugin and it starts recording Googlebot visits, with nothing to configure.
- Open Tools → Kokoa - Googlebot Log and pick the range: 7 días, 30 días, 60 días or 90 días (7, 30, 60 or 90 days).
- Review the charts and the Top 20 URLs rastreadas (top 20 crawled URLs) and Top 10 IPs tables; the data is cached for 5 minutes and ↻ Refrescar (Refresh) recalculates it straight away.
Requirements
- Write access to the plugin folder, where the daily logs are stored.
- Chart.js is bundled with the plugin: the dashboard loads nothing from outside.
Want it on your WordPress site?
We'll install it and adapt it to your site: where to keep the logs, how long to keep them and which bots to track.